Maintenance objectives improve an enterprise’s performance through actions, efforts and oriented decisions. They guarantee systems and assets work efficiently and effectively, with minimal environmental incidents and at minimum costs. One way of achieving objectives is to give sustenance to these maintenance actions and decisions, knowing and modeling the behavior of an asset’s mayor components. Once a model is verified, the continuous improvement process can take place. The objective for this two-part article is to illustrate this process through the valve housing of a high pressure positive displacement pump.
THE PIPELINE
In 1997, Minera Alumbrera commissioned the world’s longest copper concentrate slurry pipeline in the Andean mountains of Argentina. The transport system combines a 317 kilometer (km) slurry pipeline. The pipeline profile dictated the need for a complex concentrate pipeline design incorporating three pump stations. At the mine site (2400 m elevation), the mainline pumps are used to overcome friction losses to station 2 (145 km away at 1400 m elevation). At this pump station, the line pressure is boosted in order to overcome lift and friction and provide suction feed to the mainline pumps at pump station 3 (located at 1830 m). The line pressure is finally boosted to overcome elevation lift and friction in order to reach the pipeline's highest point. From there the slurry flows by gravity to the terminal 150 km away.
The pipeline pump is a single acting pump with three cylinders and three pistons. Each acting piston uses propelling liquid to drive a diaphragm, which pumps the slurry. This enables low-wear components to be used and to pump solids containing liquid or slurry at a high pressure. One pump crank shaft drives three single acting pistons, driving in total three diaphragms. With every revolution of the pump crank shaft, each piston makes one suction stroke and one discharge stroke.
It’s easy to see that the suction valve housing is stressed with an alternative load, which is proportional to the difference between the suction and the discharge pressure. This situation combined with abrasion and corrosion makes this component an icon to be studied with detail. So that what can be improved on it, could also be successfully translated to the others.
The first step is to determine the component. Once the component is determined, it is mandatory to establish its behavior in order to find any improvement opportunity. In this instance, the processes consisted of modeling the component in a virtual environment for the purpose of finding potential or existing structural issues. We looked to understand the behavior of the suction housing while considering the maximum acceptable wear suggested by the manufacturer.
It can be advertised that in worn housing, the stress doesn’t reach warning structural limits. The main stress is found in the conical area that adjusts the valve seat by analyzing the change out history, excepting for those who show infant mortality and with focus on those that reached a failure status or were close to (according the inspection reports).
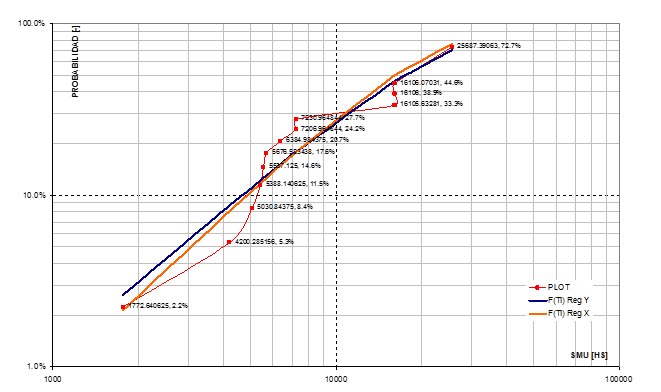
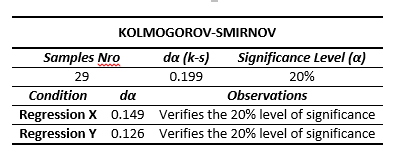
A population of 29 cases were analyzed by adjusting two failure probability curves (X and Y regressions). Both of them were followed by KOLMOGOROV-SMIRNOV test to determine which fit best.
Knowing the housing events history (faults, scheduled changes, etc.) and ordering them according to duration, allowed us to determine the probability for each failure.
Next, we adjust the equation of the shape:

This adjust is done both in the abscissa and in those ordered to home (Regression X and Y in Figure 1). A first test using the correlation coefficient (ρ) show whether the lineal approximations fit inside the desired accuracy range.
Figure 1

Table 1

The Weibull parameters that fit best where selected using the Kolmogorov-Smirnov model (Table 2).
Table 2

While both regressions are verified, Regression Y shows the smallest deviation (0.126). Therefore Weibull parameters that describe the behavior of a Box will be:
Table 3

With those values the probability distribution function acquires the follow expression:

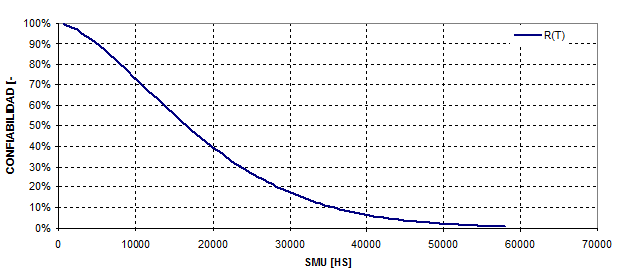
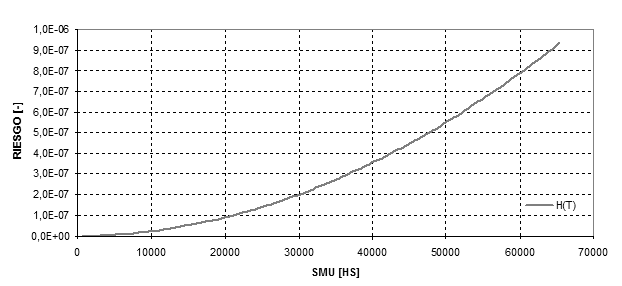
In the same way the reliability and risk functions acquire the following shapes, its graphical representation are shown in Figure 3 and 4 respectively.

Figure 3

Figure 4

The Risk function shape let us identify wear as the main failure mode in this component.
In the second part of this article, we will take a closer look at these processes, equations and their outcomes.