This is the third installment in a three-part series on the correlation between reliability and safety.
So, Does a Correlation Exist?
So far we have discussed the differing views of Safety and Reliability, and how they can result in differing conclusions. I often wonder if Safety were to define Reliability in the holistic manner that seasoned Reliability professionals do, would their perspectives be different?
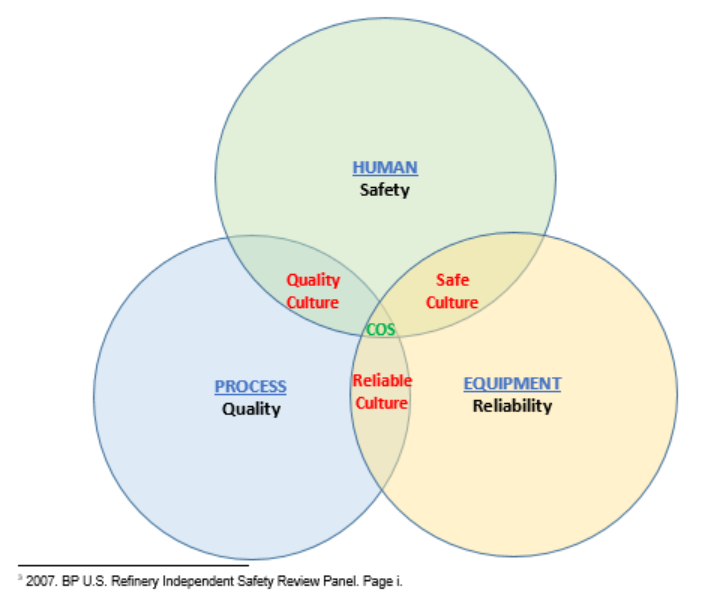
Figure #5: Holistic Reliability: Equipment, Process and Human Reliability
A holistic Reliability approach will include equipment, process and human Reliability. As Figure #5 shows, these critical elements of Reliability are inter-dependent. As stated earlier, many view Reliability only as dealing with equipment and its components. However, process Reliability is also a necessity for uniform operations. Product Quality, in part, relies on a reliable process. Lastly we have the human element which is integral to both equipment and process Reliability. Human Performance obviously is the foundation of Safety. So an effective Reliability approach will include Quality and Safety approaches in order to be successful. Unfortunately these fields are often treated as their own silos and operate independent of each other.
My initial intent was not only to discuss the potential correlation, but to seek out field data that would support or refute it. On my original LI post on this topic[1], I asked for such data from those in the Reliability and Safety communities. With over 27k views of that post and over 100 comments, only one source of such hard data was offered to support such a correlation, although not a direct correlation (as I suspected). I will note that many who did respond were vehement that such a correlation existed in their experience, but their ‘evidence’ was more along the lines of ‘gut feel’ as opposed to having hard numbers to back it up. I too was in that ‘gut feel’ camp.
An article was brought to my attention, ‘A Reliable Plant is a Safe Plant is a Cost-Effective Plant[2]’ by Ron Moore. I have known Ron from many years ago and reached out to him for his perspective on this important issue. In my opinion, Ron is undoubtedly one of the most respected Reliability pioneers of this era.
Ron stated that “This (Dr. Leveson’s data) appears to be an incorrect interpretation or characterization of the data. My data says that safety is improved by improving system Reliability (and by inference component reliability). If you reduce the failures, both component and system level, you reduce the exposure to the risk of injury and therefore the probability of injury. However, I agree that it does not mean that accidents will not occur, since accidents are caused by any number of variables, some of which are not controlled by Reliability excellence. I also agree that Safety is a system property, not a component property, and must be controlled at the system level. In my view, one of the best, if not the best, measure for Reliability is OEE/AU, a system level measure. Reliability isn’t just about maintenance, but her (Dr. Leveson) statements/assumptions seem to imply that it is. Indeed, my data says that maintenance typically only controls some 10% of the loss of production capacity captured in the OEE measure. Moreover, Reliability is driven by our practices in design, procurement, stores, installation, startup, operation and maintenance, all of which contribute positively or negatively to system level Reliability (not just equipment or components). Reducing the number of defects in these practices, both within each function and cooperatively as a team, will improve Reliability and reduce the risk of injury, while reducing costs and environmental incidents.”
To ensure we are all on the same page, Ron’s definition of OEE/AU used is as follows:
Overall Equipment Effectiveness (OEE) and Asset Utilization (AU) - both of which measure the percent of ideal at which a plant is operating – the higher the OEE or AU, the more reliable the plant. AU is OEE + No-Demand Losses; so if you’re sold out, they’re equal.
In the article it shows a graph (See Figure #6) that demonstrates the correlation between Reliability (Production Capability) and Safety (Injury Rate). This graph is from a large U.S. manufacturing company ($7B+ in annual revenues) over a five year period, representing 10+ plants around the world.
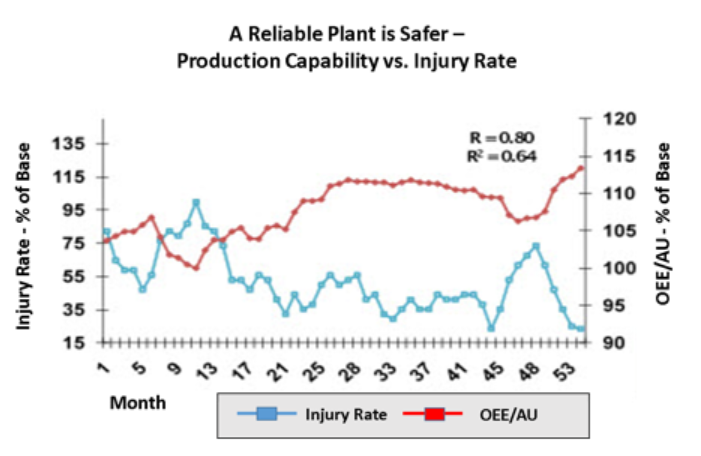
Figure #6. Production Capacity vs. Injury Rate*
* The data have been normalized, that is, a base number was selected and all the other numbers divided by the base number. The correlation coefficient, or R, is 80% for this data, a remarkable correlation for industrial data. This data makes the argument that when the plants are running well (high Asset Utilization), then injuries are less likely. You’re not reacting to the most recent failure and risking injury, as well as higher costs and poorer overall performance.
While I am citing only one case study of Ron’s, he indicated he has several (6 that include paper mills, pulp plants, steel mills, food plants and chemical plants) but the results are all very consistent with each other. Based on this hard data, a strong case can be made that a reliable plant is a safe plant (as well as a cost effective plant and environmentally-sound plant).
Conclusion
We started this paper by exploring how Safety views Reliability, as expressed in Dr. Leveson’s and Dr. Conklin’s cited books. Their view of Reliability is very narrow from that of the seasoned practitioner’s perspective. If this research/academic view represented reality, the conclusions drawn in the text would almost certainly be valid.
However, when Reliability professionals talk about Reliability, they are applying system’s thinking and looking at the whole business enterprise (i.e. – OEE and AU) - the refinery, paper mill, steel mill, chemical plant to be able to deliver its product in a timely, cost effective, and safe manner.
When Reliability is viewed as a holistic system and not simply component-driven, the field data presented, shows when the OEE improves, safety improves. Also, we have only been able to show data from a single organization, with multiple facilities. Ideally we would like to have like data sets from multiple organizations to increase the sample size. I am not sure if this data exists and I suspect, if collected from the different organizations, what was collected and how it was collected would vary widely.
Another concern that would come to mind would be leadership support at each organization and their respective infrastructures to manage the initiatives. We all know those variables would differ as well, making comparing the two data sets nearly impossible.
Some questions I would have of any data collected, would be:
- In the case presented, we demonstrate a reliable operation is a safer operation. However, is a safer operation a more reliable operation (likely not as the costs and constraints of an ultra-safe operation would most certainly restrict optimizing Reliability)? These battles are fought daily on the production floors.
- Does data exist to show the % of time that reported injuries and fatalities occur during uptime or downtime periods? Or, the % of time that injuries and fatalities occur during planned or unplanned downtime?
Relative to question #2 above, I was able to find the following data:
- DuPont reported[1] that the most likely person to be injured is*:
- a maintenance technician,
- with less than two (2) years’ experience,
- doing reactive work
- Exxon-Mobil reported[2] that accidents are five (5) times more likely in maintenance when doing breakdown work than when doing planned and scheduled work.
- In ~66% of companies, ~60% of injuries occur while doing reactive maintenance[3].
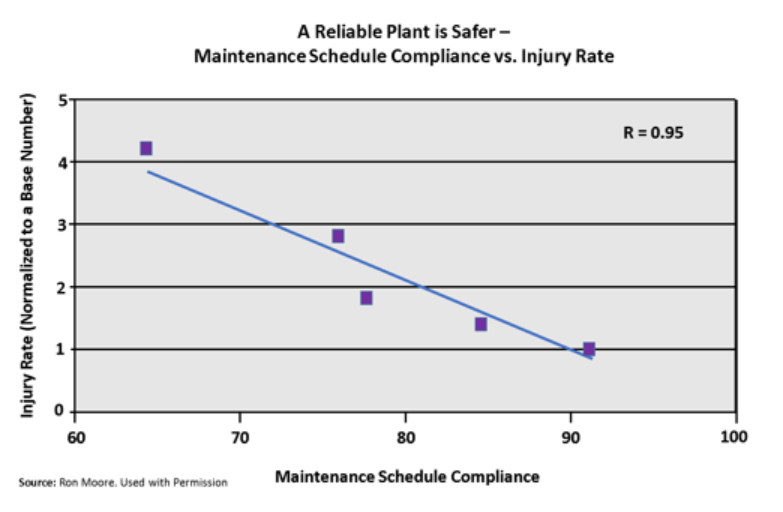
Figure #7. Injury Rate versus Maintenance Schedule Compliance
These reports are consistent with Ron Moore’s data, in this case, Figure #7 is demonstrating that injury rates are higher during periods of non-compliance with maintenance schedule (reactive maintenance)[1].
This preliminary data supports that most injuries do occur during reactive periods (unexpected upsets and reactive maintenance). Given that, we have demonstrated a loose correlation exists, but not a direct correlation. We all know that safety is certainly impacted by the actions of those not directly responsible for optimizing operational Reliability, so injuries and fatalities can occur outside the envelope of Reliability.
If we work in a facility that runs continuously (high reliability operation) we worry less about getting hurt. When we have downtime (especially unplanned downtime), there is a disruption to the norm which introduces uncertainty and a degree of chaos. It is at these times where we do not feel as safe as we would during continuous operations. The individual is thinking more about solving the problem at hand and less about protecting their individual safety.
In the absence of such definitive data, I think this boils down to our own intuitiveness about safety and our own situational awareness.
I always like to end with something for us all to think about. This saying seems appropriate for both the Safety and Reliability topics discussed in this paper:
“We NEVER seem to have the time and budget to do things right, but we ALWAYS seem to have the time and budget to do them again!”
Robert (Bob) Latino is CEO of Reliability Center, Inc. (RCI). RCI is 40+ year old Reliability Engineering Consulting, Training & Software Development firm specializing in Equipment, Process & Human Reliability. Bob can be reached at blatino@reliability.com. Please visit www.reliability.com for additional information and resources.
[1] Moore, Ron. A Reliable Plant is a Safe Plant is a Cost-Effective Plant. Accessed on 1.17.18 at https://www.lce.com/A-Reliable-Plant-is-a-Safe-Plant-is-a-CostEffective-Plant-1266.html?lipi=urn%3Ali%3Apage%3Ad_flagship3_detail_base%3B1H3nPy1KS%2Fadof86TbHgEA%3D%3D
[2] Latino, Robert. Is There a Direct Correlation Between Reliability and Safety?. Accessed on 1.17.18 at https://www.linkedin.com/pulse/direct-correlation-between-reliability-safety-bob-latino/
[3] Moore, Ron. A Reliable Plant is a Safe Plant is a Cost-Effective Plant. Accessed on 1.17.18 at https://www.lce.com/A-Reliable-Plant-is-a-Safe-Plant-is-a-CostEffective-Plant-1266.html?lipi=urn%3Ali%3Apage%3Ad_flagship3_detail_base%3B1H3nPy1KS%2Fadof86TbHgEA%3D%3D.
[4] Andrew Fraser. Reliable Manufacturing, Ltd.
[5] Levitt, Joel. Uptime Magazine. Aug/Sept. 2011
[6] Christer Idhammer, IDCON, Raleigh, N.